Know which buildings are over budget—and what's driving it.
SNFPPD brings your OnCare purchasing data into one organized dashboard. Track spending against each building's PPD targets, compare vendor prices, and investigate the orders behind budget overruns.
For nursing-home owners, administrators, and procurement teams.
| Building | Residents | Target | PPD | Variance | Status | |
|---|---|---|---|---|---|---|
| Lakeside | 200 | $9.00 | $10.58 | +$8,848 | Over | Orders → |
| Maple Grove | 150 | $9.00 | $12.67 | +$15,414 | Over | Orders → |
| Willow Creek | 120 | $9.00 | $9.30 | +$1,008 | Over | Orders → |
| Harbor View | 180 | $9.00 | $7.90 | ($5,544) | On target | Orders → |
| Riverside | 100 | $9.00 | $8.92 | ($224) | On target | Orders → |
You know the budget. Finding the problem takes longer.
When a building goes over budget, procurement needs to understand what changed and where to act.
Which buildings need attention?
Not after the month closes — while there is still time to change the next order.
Are higher prices or larger orders driving spending?
The same dollar overrun means two different conversations.
Which purchases should procurement review?
The specific orders, items and vendors — not a category total on a spreadsheet.
SNFPPD brings the purchasing information together so your team can investigate and make informed decisions.
Your buildings. Your budgets. One clear view.
Compare purchasing spend with each building's per-resident-per-day budget.
Every building is measured against its own approved PPD target. Review the week in progress and the month to date, and see which buildings are over, which are on pace, and by how much.
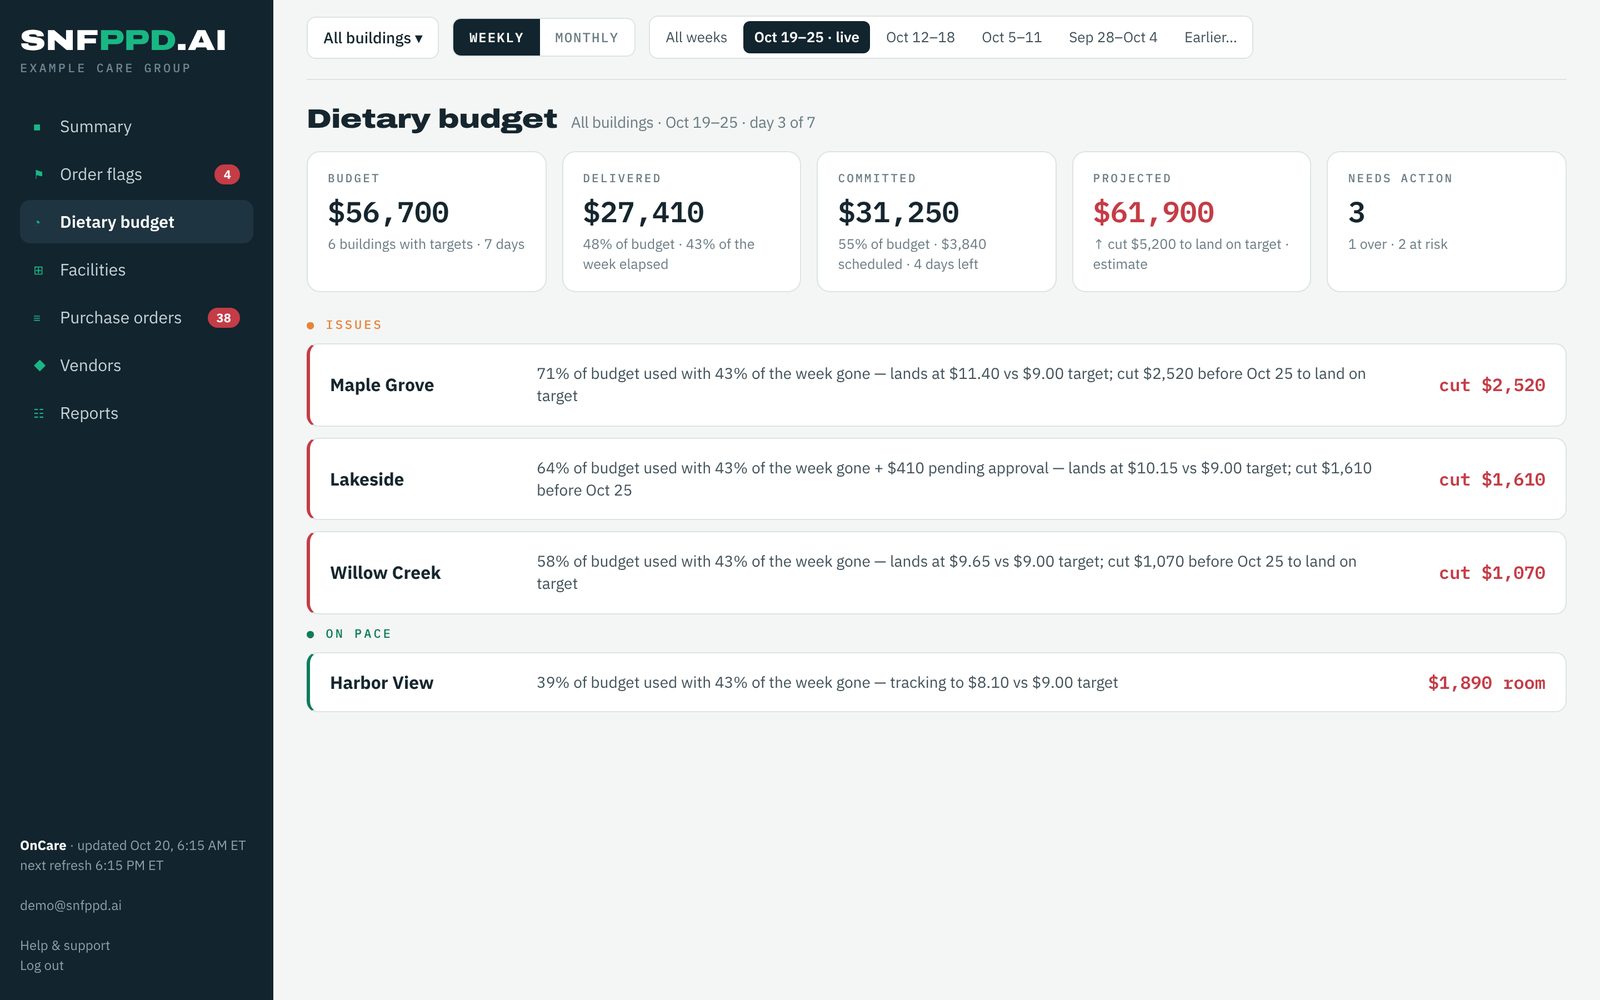
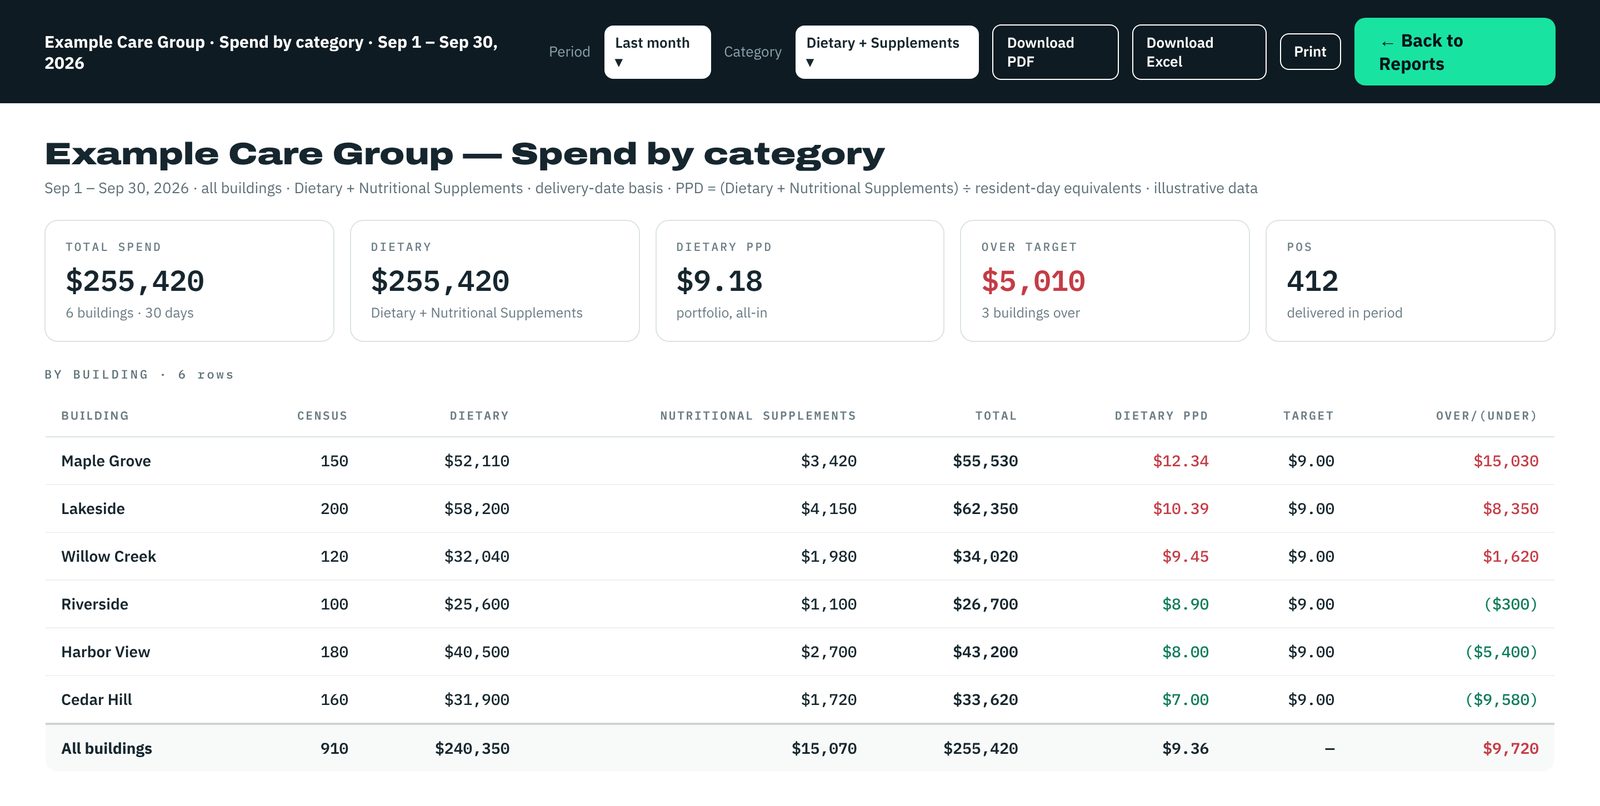
Open a building's purchasing detail to see what is behind the number.
Categories, vendors, items and individual purchase orders — by building, by week or by month. Every total on the dashboard opens to the orders that make it up.
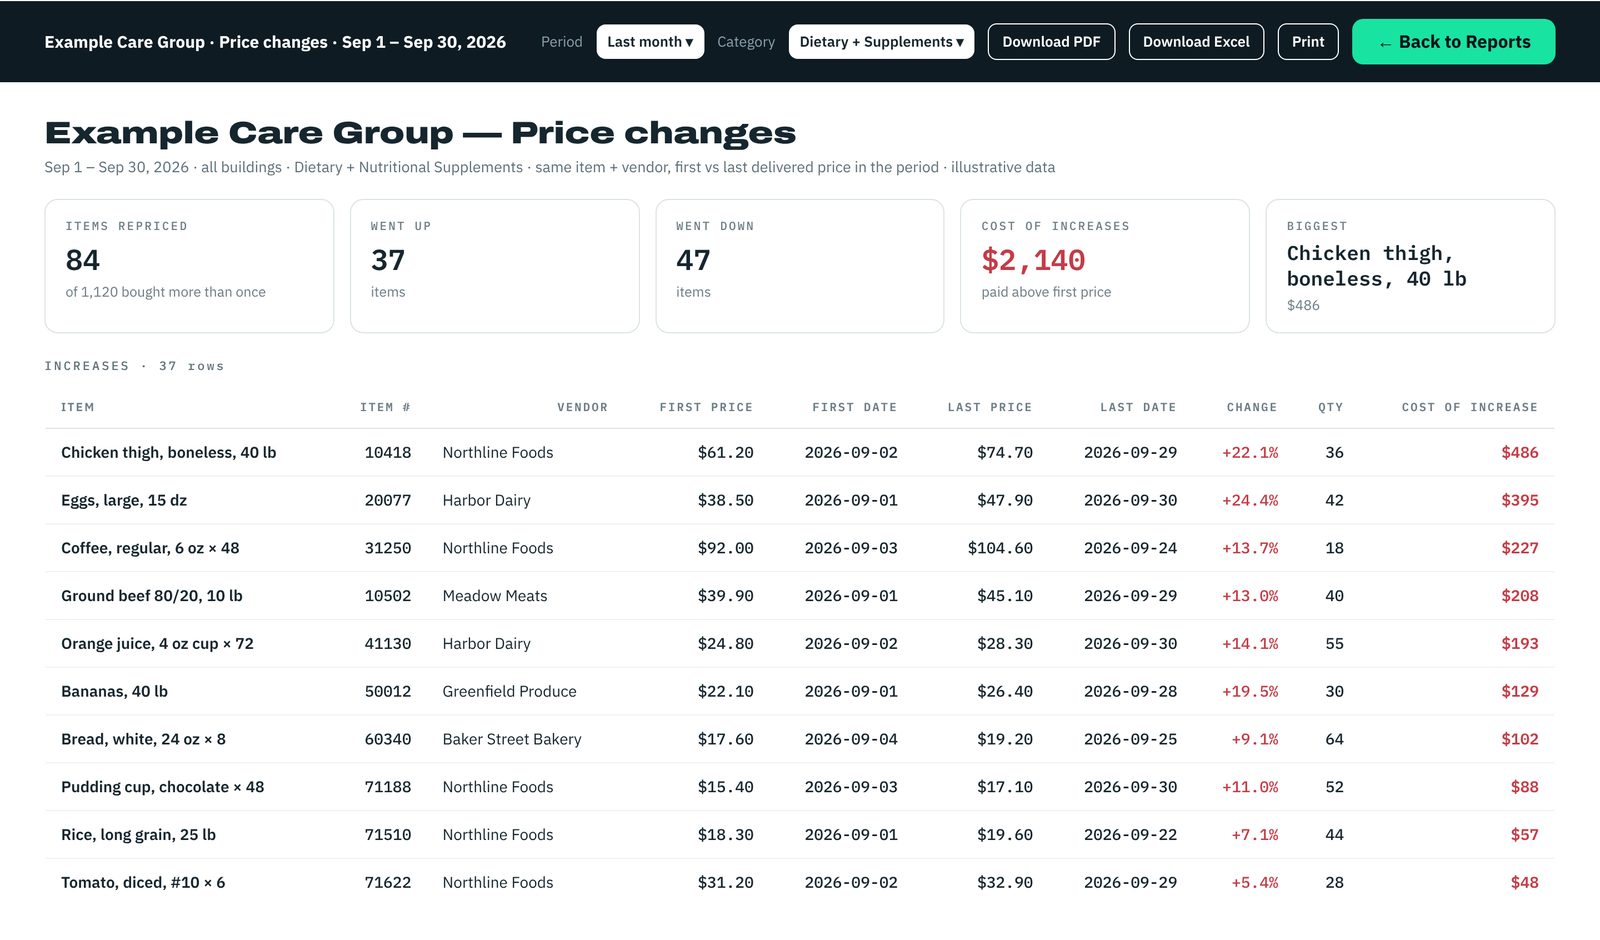
See price changes and purchasing patterns worth a second look.
The same item from the same vendor — first price versus last price in the period, and what the increase cost. Products bought from more than one vendor are shown side by side so procurement can decide where to investigate.
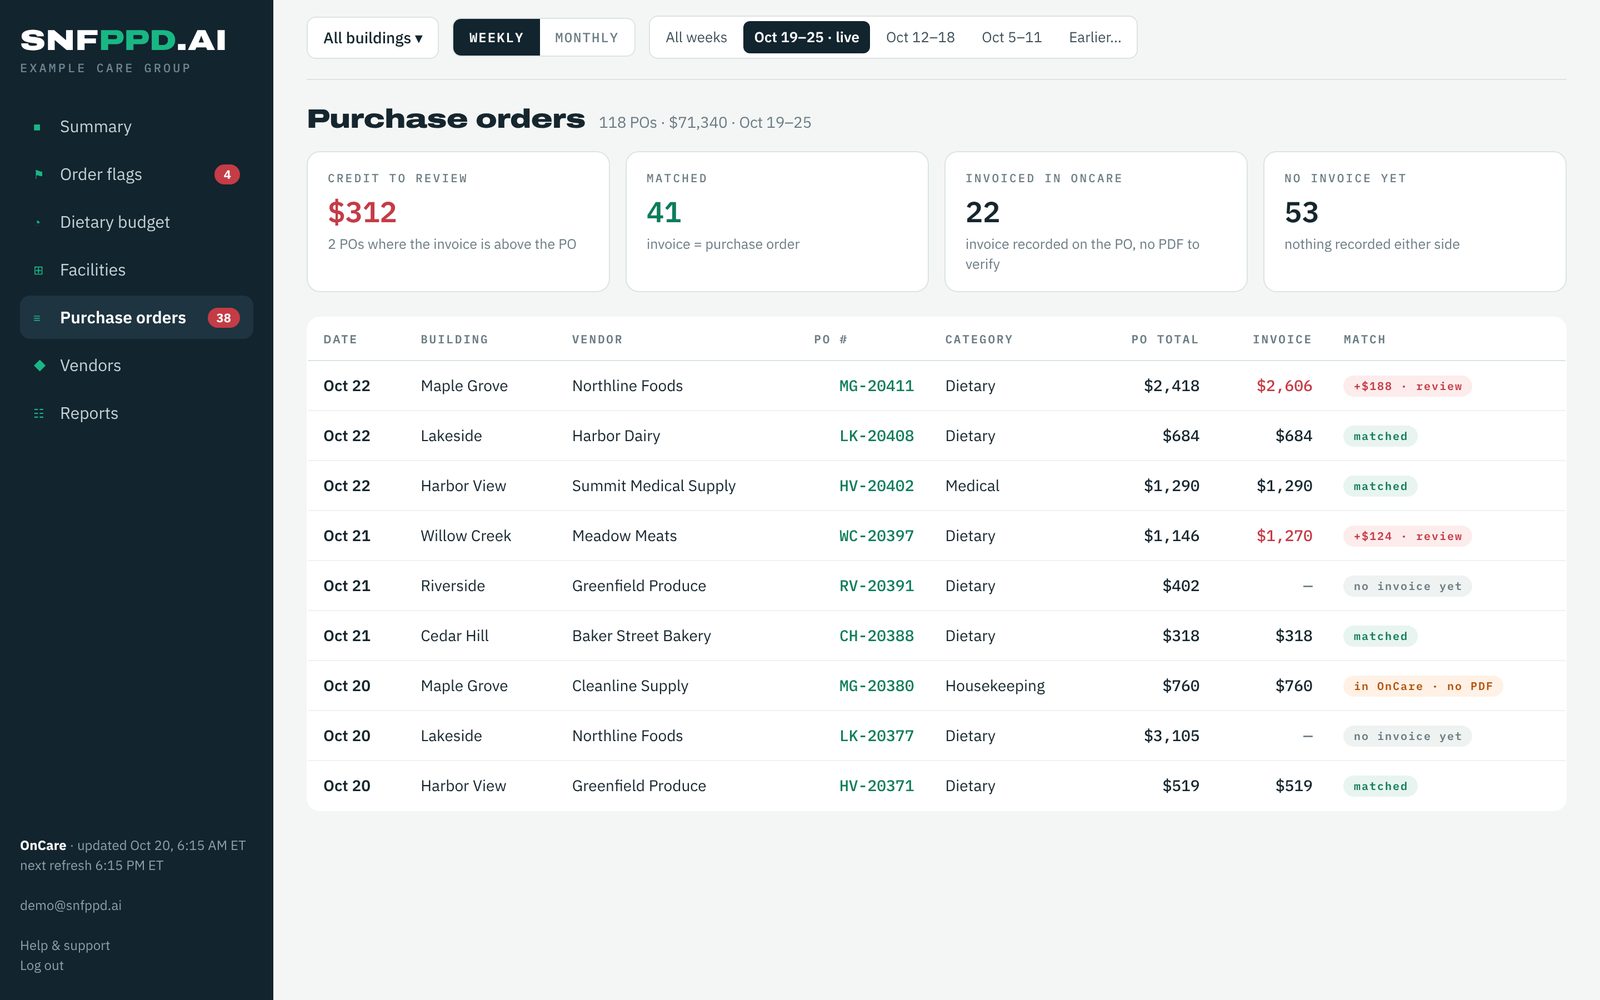
Purchase orders and invoices side by side, with the detail to review.
Where a vendor invoice is on file, it is matched to its purchase order and any difference is shown next to the PO total — so your team can review it with the supporting detail, decide whether it warrants a question to the vendor, and track it to a resolution.
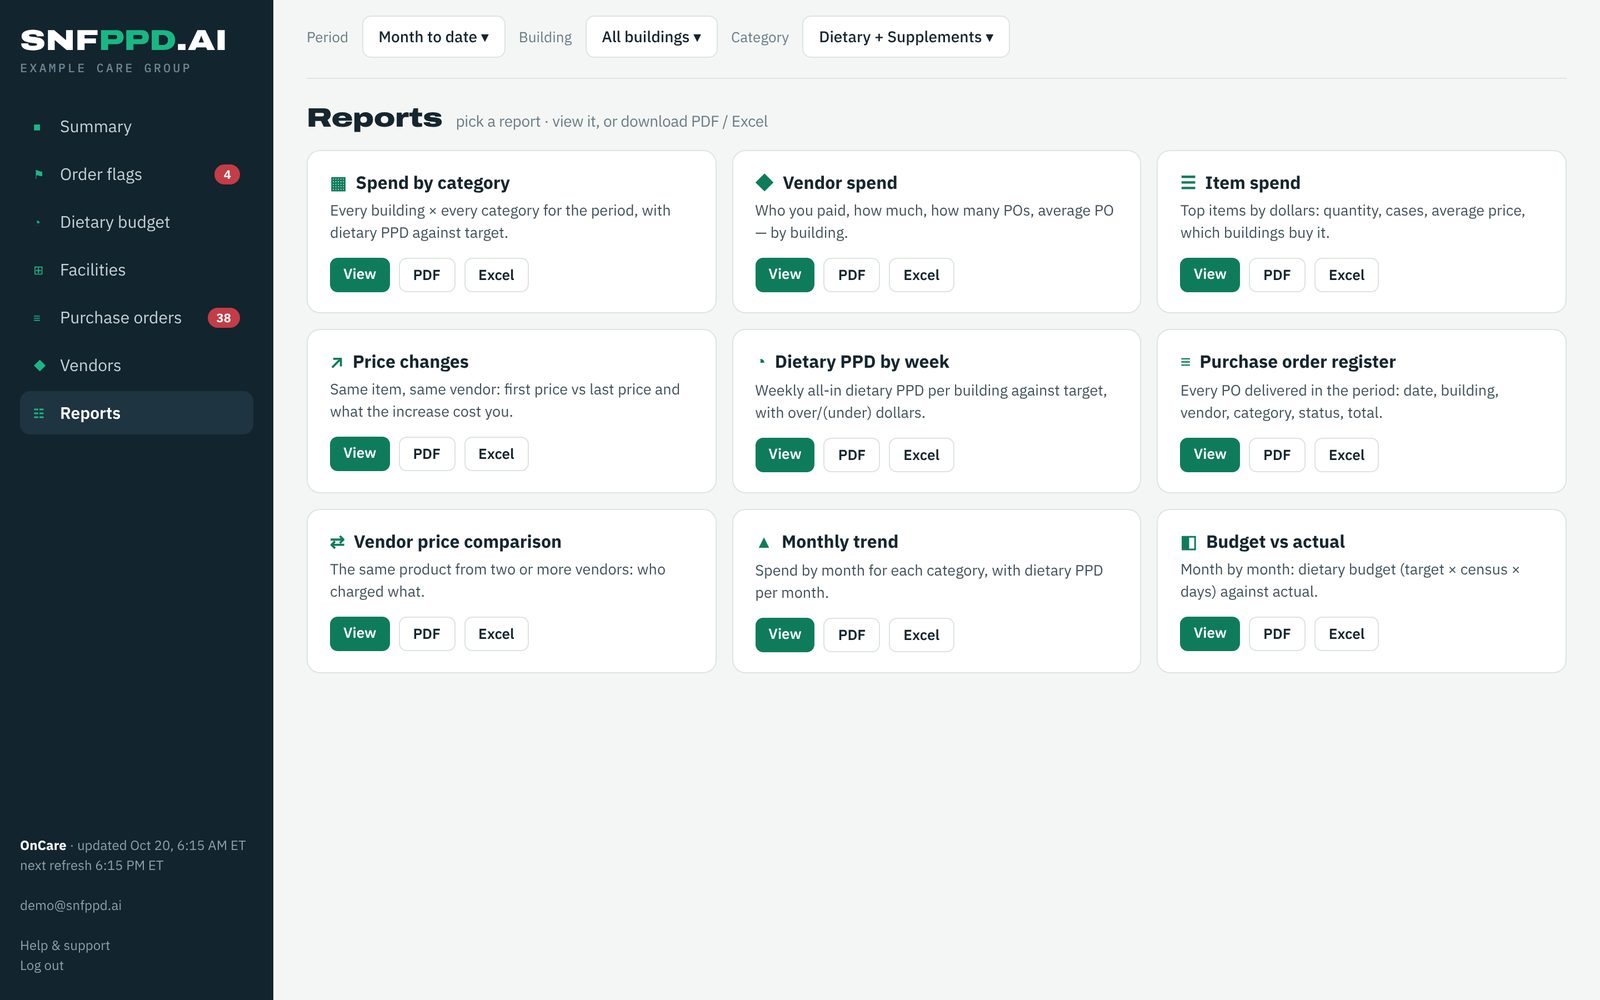
Reports you can take with you. Every view exports to Excel and PDF — spend by category, vendor spend, item spend, price changes, PPD by week, budget vs actual, vendor comparison and more — for any period and any set of buildings.
From budget concern to informed action.
Spot the building
See which facilities are above their target, or projected to exceed it before the week is out.
Review the detail
Inspect the purchasing records, quantities, categories and vendor prices behind the result.
Decide what to change
Give procurement the information to review upcoming orders, discuss purchasing with dietary directors, or negotiate with vendors.
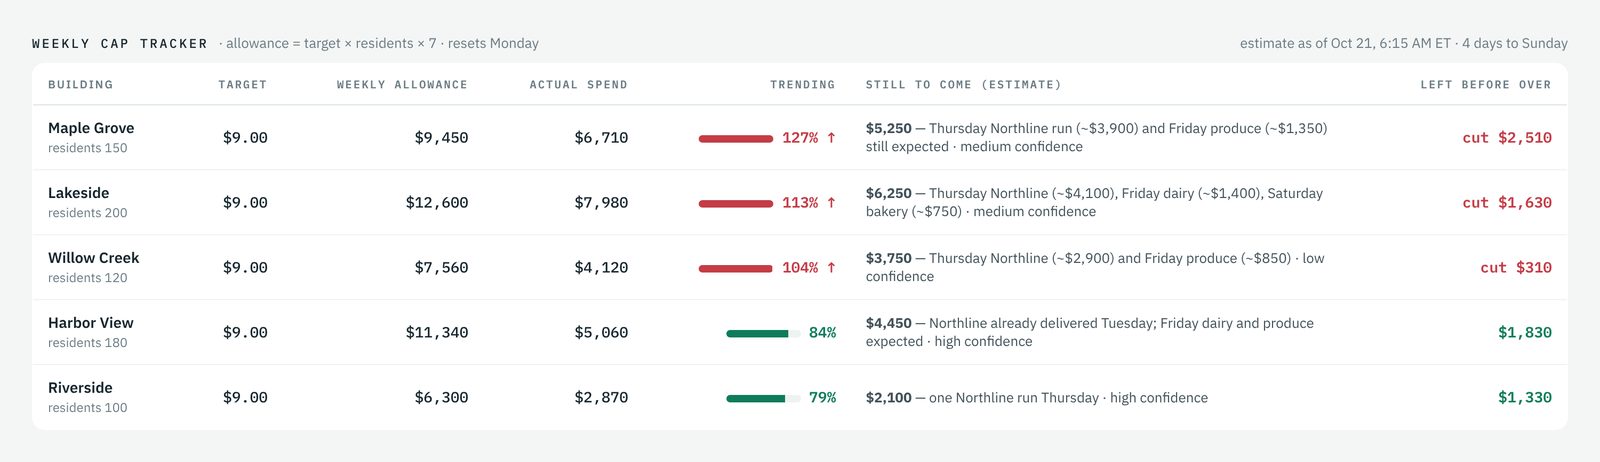
Weekly projections so the conversation happens on Wednesday, not next month.
Each building's weekly allowance is compared with what has been delivered and what is still expected from its usual vendors. Projections are estimates, labeled as such, and shown with the time of the last data refresh.
SNFPPD supports your team's decisions. It does not place or change orders, negotiate with vendors, or rewrite menus — your people do, with better information.
What happens when you get an account?
- Your organization gets its own portal.Your buildings are organized in one place at your-organization.snfppd.ai, with logins for the people you choose. Access is set up by our team — there is no self-serve signup.
- Your OnCare purchasing data is brought in.Using an OnCare login you provide, we load your purchase orders and available census data — including history back to the month you choose, so you can see trends from day one.
- Spending is compared with your PPD targets.Each building gets its own target, set with you during setup and adjusted by our team whenever you ask.
- Your team reviews, investigates and exports.Budgets, orders, vendor comparisons and reports — on desktop or phone, with Excel and PDF exports.
See what a lower PPD could mean.
Purchasing spend is a per-resident, per-day number multiplied across every building, every day of the year. Small changes add up.
Frequently asked
Who is this for?
Nursing-home owners, operators, administrators and procurement teams managing purchasing budgets across one or more buildings.
Do we need to use OnCare?
The current product organizes and analyzes OnCare purchasing data. If you purchase through another system, contact us to discuss your setup.
Does this replace OnCare?
No. OnCare stays your purchasing system — orders are still placed and approved there. SNFPPD is a visibility and analysis layer on top of that data: budgets, comparisons, exceptions and reports in one place, by building.
Can each building have its own PPD target?
Yes. Targets are set per building during setup, and our team updates them whenever you ask. They are not edited by customers directly inside the portal.
What costs does it track?
The purchasing categories available in your connected data — dietary and nutritional supplements, medical supplies, housekeeping and the other categories you order through OnCare. It is not a complete operating-cost or accounting system.
How often is information updated?
Once a day, every evening. Each screen shows the time of the last refresh.
Will it automatically reduce spending?
No. It helps your team identify issues and opportunities, investigate the supporting records, and decide what action to take.
See how your team could manage purchasing budgets with a clearer view.
Walk through building-level PPD tracking, purchasing detail, vendor comparisons, and reporting — on your own numbers if you'd like.
Thanks — we'll email you within one business day to set up a time. If it's urgent, call 646-644-4641.